Hourly mentions of a word on Twitter
23 May 2015Some time ago (ok a month ago—time ✈️s), I saw this tweet:
Need a simple tool to track mentions of a keyword on Twitter by hour. Don’t need a bunch of bells and whistles. Thoughts?
— Kaegan Donnelly (@kaequan) April 23, 2015I thought, “should be easy, lmgt.” However, results for the query “hourly mentions of a word on twitter” didn’t offer clear solutions. Days later I came across two relatively simple approaches to tackling the problem. The first is Tweepy. The other is Logstash.
Tweepy is an open source Python library for accessing the Twitter API, including the Twitter Streaming API.
Logstash is an open source tool for collecting, processing, and forwarding events. Logstash can read events from the Twitter Streaming API using its twitter plugin.
Having tried both, I recommend Logstash over Tweepy for two main reasons:
- it deals with the Twitter API rate limits by default
- it offers Elasticsearch and Kibana integration—simplifying the aggregation and visualization steps, respectively, that naturally follow the data (tweet) collection step
For both Tweepy and Logstash you need access to Twitter’s streaming API. Follow steps 2 and 3 here to create a Twitter app and obtain your Consumer Key, Consumer Key Secret, Access Token, and Access Token Secret.
The ELK solution
Download and install Elasticsearch, Logstash, and Kibana. If you are on a Mac, you can
brew install elasticsearch
brew install logstash
Make sure you have Elasticsearch and Kibana running. Before running Logstash, you need to prepare a configuration file. Below is a sample configuration file to collect tweets containing the word ireland (call it ireland.conf)
# a logstash config file has three sections:
# input{}, output{}, and (optional) filter{}; add plugins
# to specify how events should be handled in each section

input {
    twitter {
        # set key and token values from the previous step
        consumer_key => ""
        consumer_secret => ""
        oauth_token => ""
        oauth_token_secret => ""
        # assume we are interested in tracking all
        # mentions of the word "ireland"
        keywords => ["ireland"]
        # no need for all fields to get hourly counts
        full_tweet => false
    }
}

output {
	stdout {
		# include this to pretty-print the event's json to stdout
		codec => rubydebug
  	}
}
To start streaming tweets, run
logstash -f ireland.confAt this point, tweets are written to stdout. In order to visualize tweet counts using Kibana, you need to save the tweets to Elasticsearch.
Add the elasticsearch plugin to the output section of the configuration
output {
    elasticsearch {
        protocol => "http"
        host => "localhost"
        index => "irelandtweets"
    }

	stdout {
		# include this to pretty-print the event's json to stdout
		codec => rubydebug
  	}
}
Run Logstash again and have a look at:
http://localhost:9200/irelandtweets/_search/?prettyBelow is a sample of the output format. You can see, for example, that 65235 documents (tweets) have been stored in the irelandtweets index
{
  "took" : 2,
  "timed_out" : false,
  "_shards" : {
    "total" : 5,
    "successful" : 5,
    "failed" : 0
  },
  "hits" : {
    "total" : 65235,
    "max_score" : 1.0,
    "hits" : [ {
      "_index" : "irelandtweets",
      "_type" : "logs",
      "_id" : "AU2B1MGZPj_44djTabLA",
      "_score" : 1.0,
      "_source":{"@timestamp":"2015-05-23T17:31:51.000Z","message":"Y'all have no idea how happy I am for Ireland 💗 Can my country say yes to equality too 😭","user":"LesbiForLauren","client":"<a href=\"http://twitter.com/download/iphone\" rel=\"nofollow\">Twitter for iPhone</a>","retweeted":false,"source":"http://twitter.com/LesbiForLauren/status/602165054042034176","@version":"1"}
    }, {
      "_index" : "irelandtweets",
      "_type" : "logs",
      "_id" : "AU2B1MGZPj_44djTabLF",
      "_score" : 1.0,
      "_source":{"@timestamp":"2015-05-23T17:31:51.000Z","message":"RT @muyskerm: @Jack_Septic_Eye Well done Ireland. The U.S. could take a lesson.","user":"SOUTHERNjamespb","client":"<a href=\"http://www.twitter.com\" rel=\"nofollow\">Twitter for BlackBerry</a>","retweeted":false,"source":"http://twitter.com/SOUTHERNjamespb/status/602165054889283584","@version":"1"}
    }, {
		...
To start using Kibana, visit
http://localhost:5601/On the Discover tab, there is a configuration form:
- Check off the box: Index contains time-based events
- Fill the Index name or pattern field with
irelandtweets - Fill the Time-field name field with
@timestamp
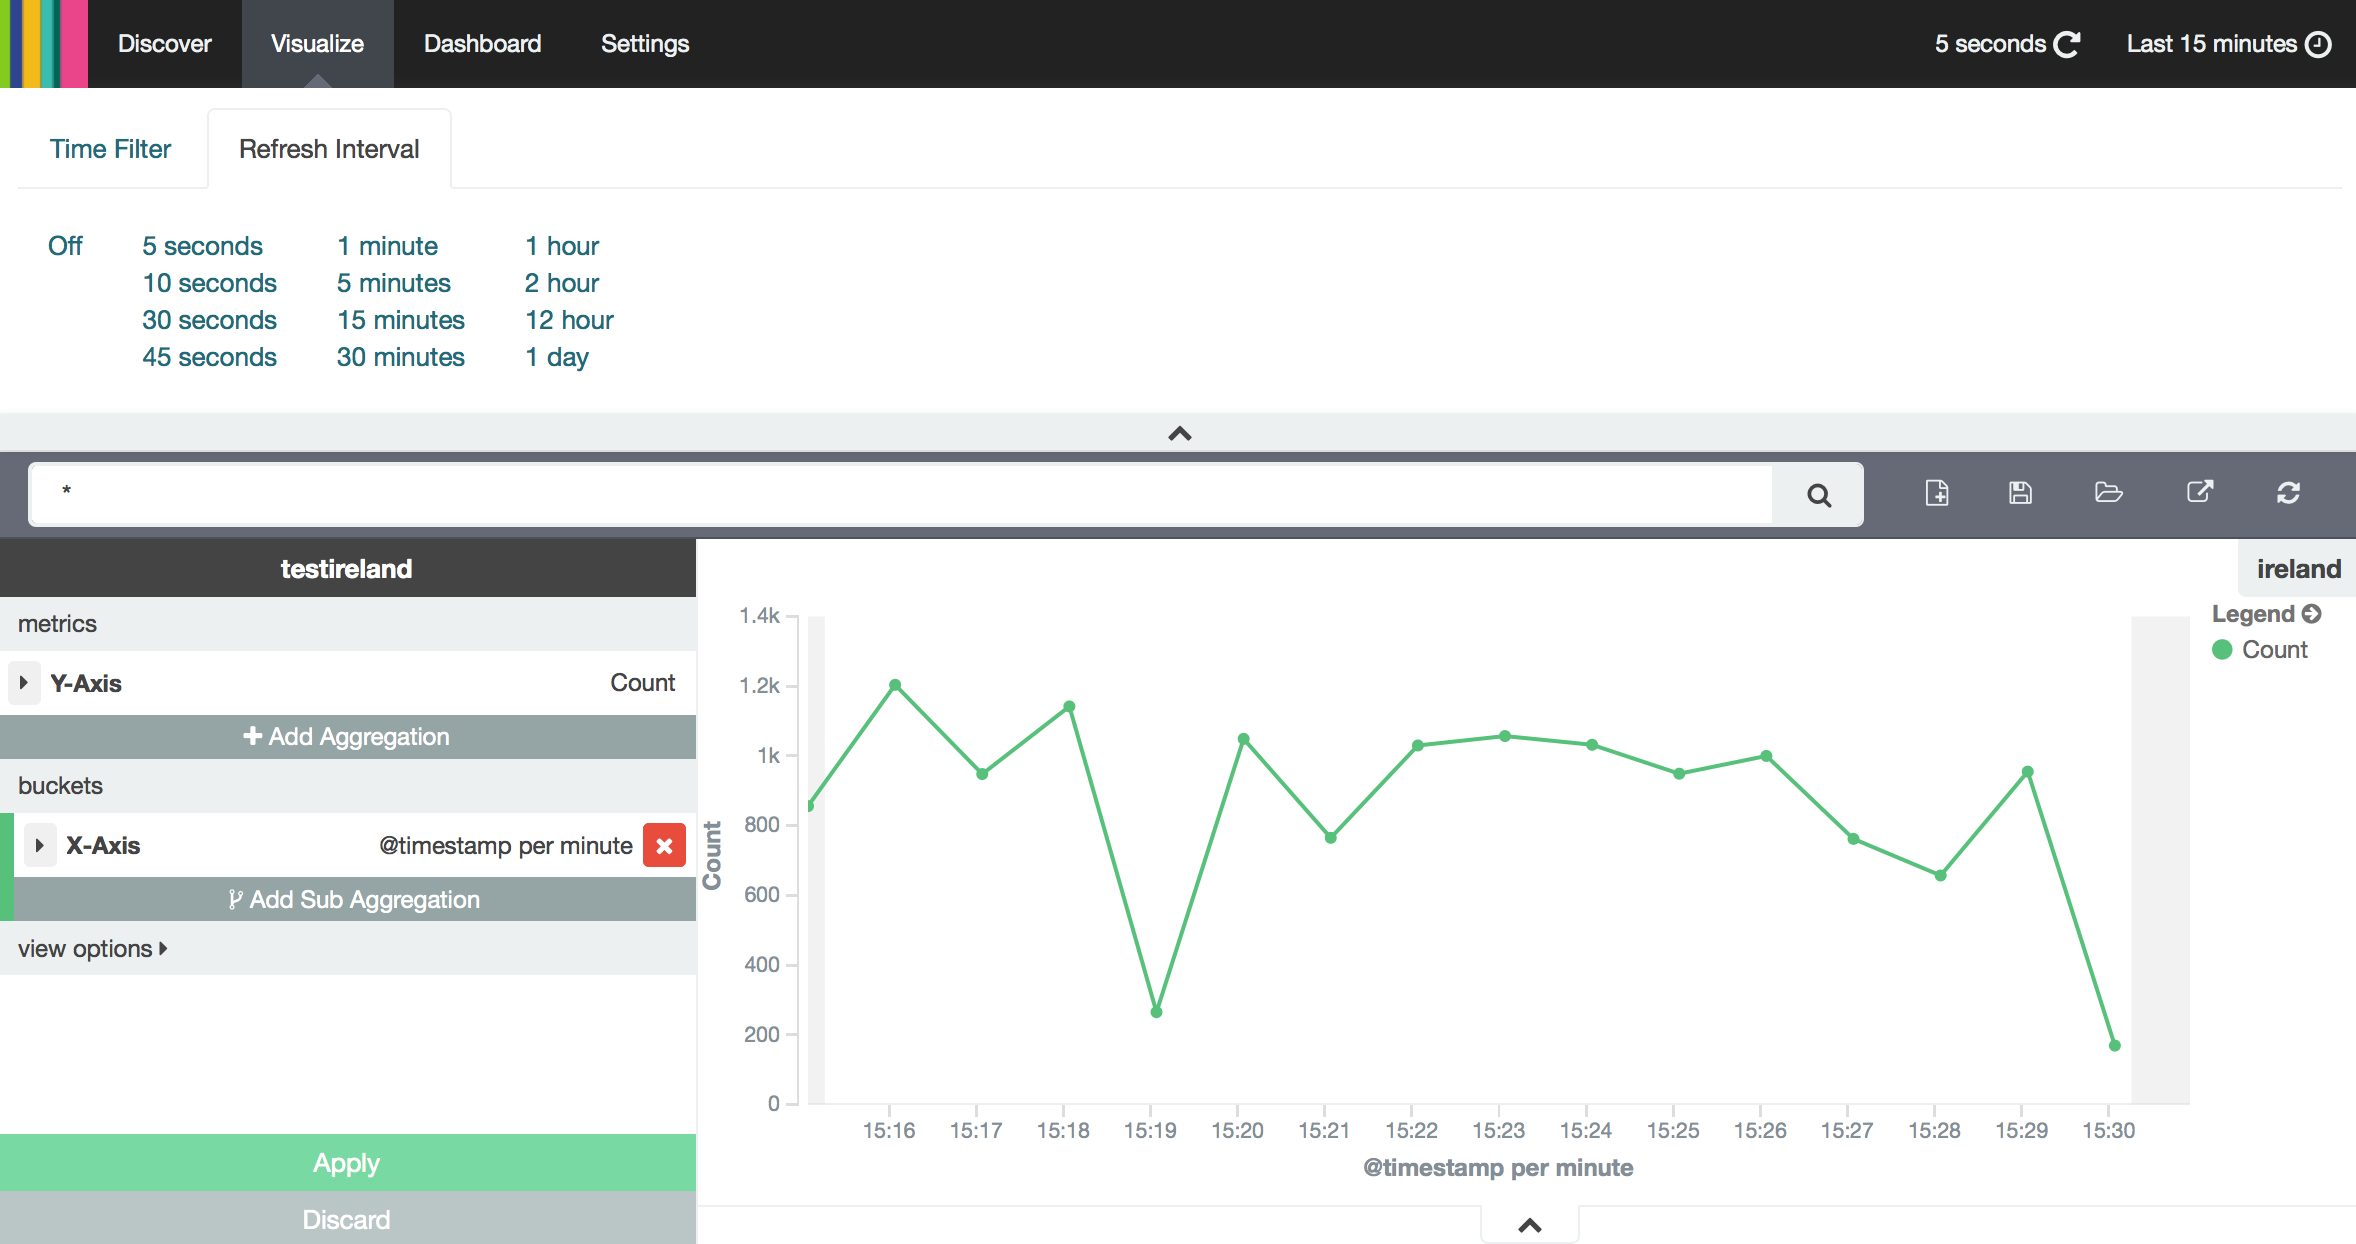
On the Visualize tab, choose visualization type Line chart.
- Choose option
From a saved searchto use the same query you specified on the Discover tab - On the left hand side, you can specify metric and bucket aggregations:
- For metric aggregation— same as Y-Axis aggregation—choose
Count - For bucket aggregation—same as X-Axis aggregation
- Fill the Aggregation field with
Date Histogram - Fill the Field field with
@timestamp - Fill the Interval field with
Minute
- Fill the Aggregation field with
- Click on the Refresh Interval tab at the top. Choose
5 secondsand see your line chart come alive 📈
Done. Thank you for starting the conversation Kaegan!
More resources
For details about Logstash plugins see this guide.
Anna Roes has written an excellent overview of Kibana in this tutorial.